Hi all
I am using to develop Visual Studio code but I would like to start using IntelliJ because gives me better tools.
My problem is when I debug because if I set a breakpoint when my code reaches it I can´t navigate in the site/console until I release the break point.
For example:
I have an scheduler executing every 2 minutes reading from a EventHub. When the scheduler reads the message my breakpoint activate.
When I am using Visual Studio Code, my next step is going to console a deactivate the scheduler unchecking the tip and saving. This way I avoid new messages arrives while I am debugging.
Well, when I am using Intellij when the breakpoint activate I am not able to operate with the console. It´s freeze, can´t save, can´t reload, can´t load.
Is there a special configuration in Intellij to do the same that Visual Studio Code.
PD I have checked the tips
Allow parallel run in the attach debug

and
Allow multiples instances in cargo.run
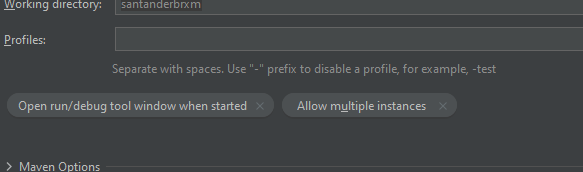
With No success ![]()
Any idea?

